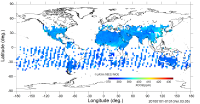
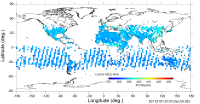
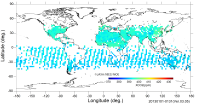
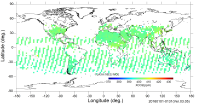
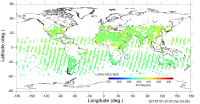
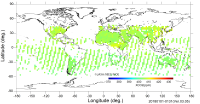
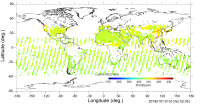
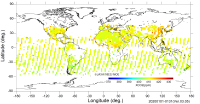
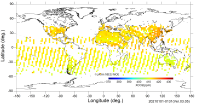
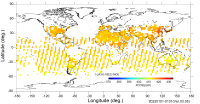
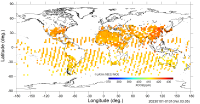
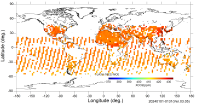
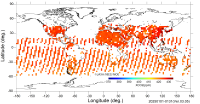
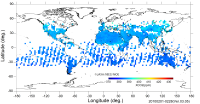
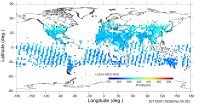
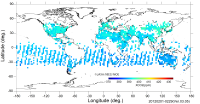
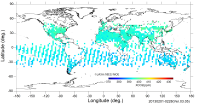
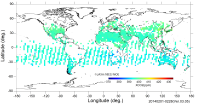
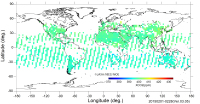
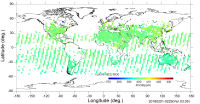
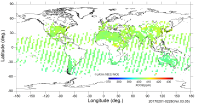
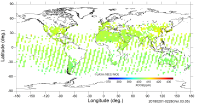
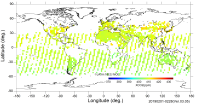
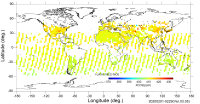
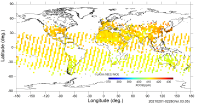
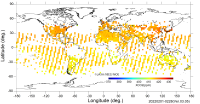
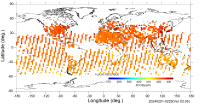
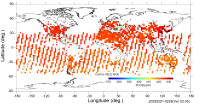
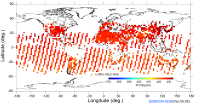
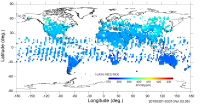
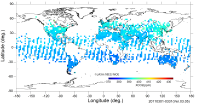
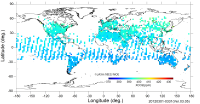
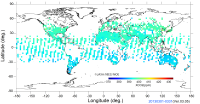
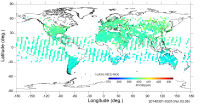
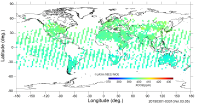
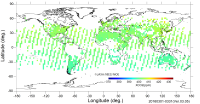
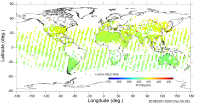
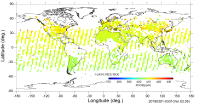
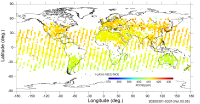
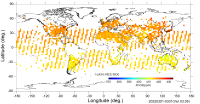
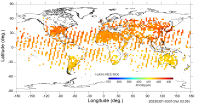
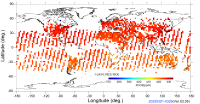
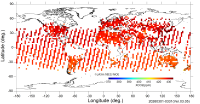
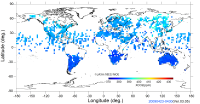
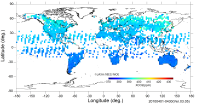
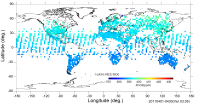
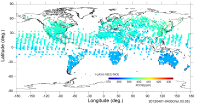
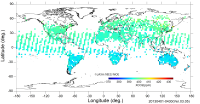
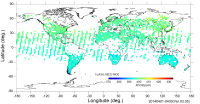
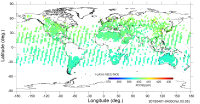
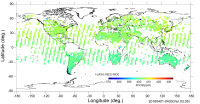
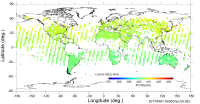
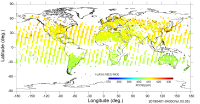
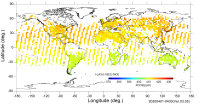
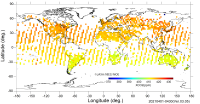
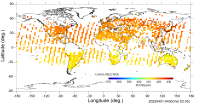
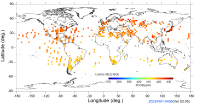
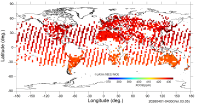
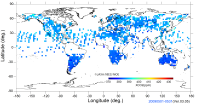
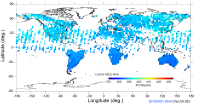
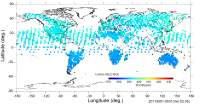
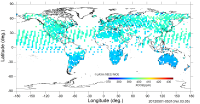
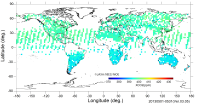
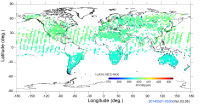
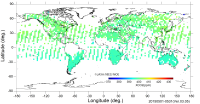
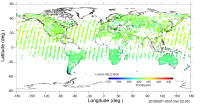
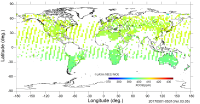
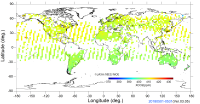
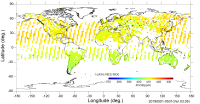
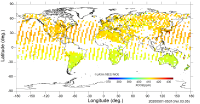
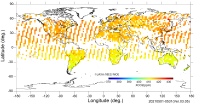
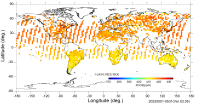
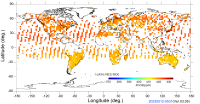
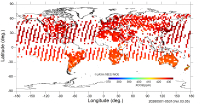
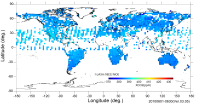
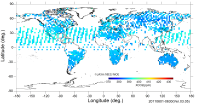
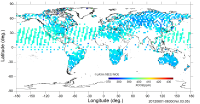
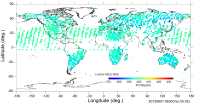
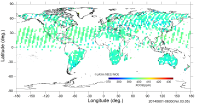
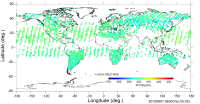
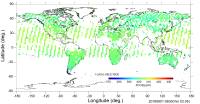
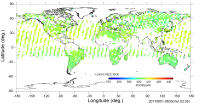
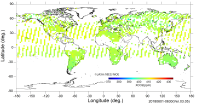
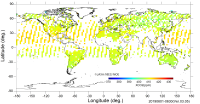
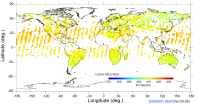
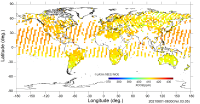
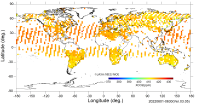
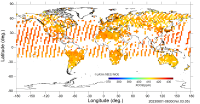
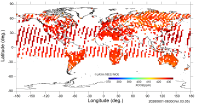
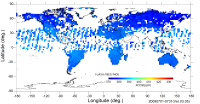
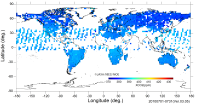
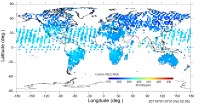
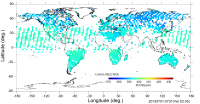
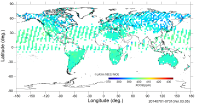
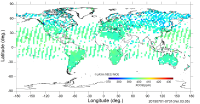
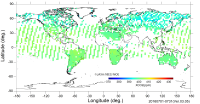
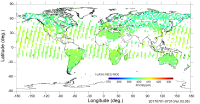
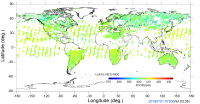
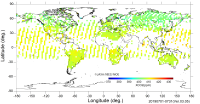
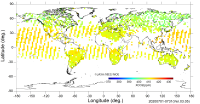
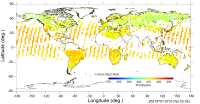
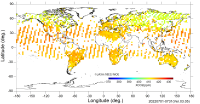
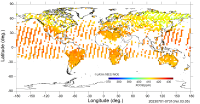
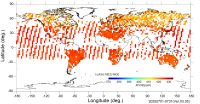
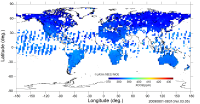
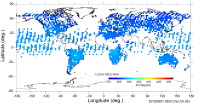
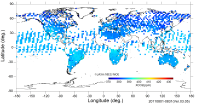
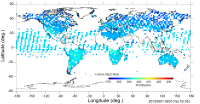
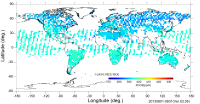
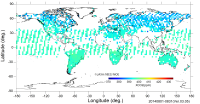
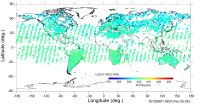
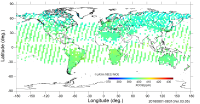
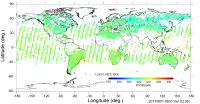
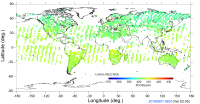
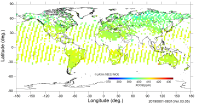
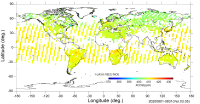
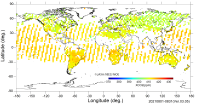
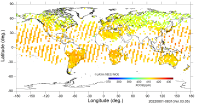
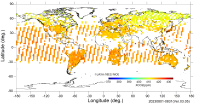
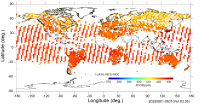
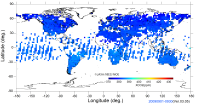
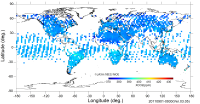
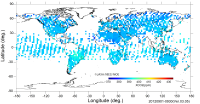
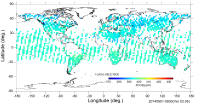
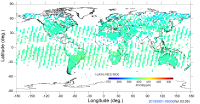
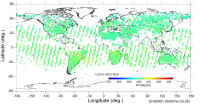
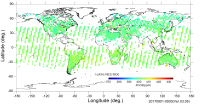
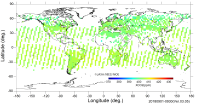
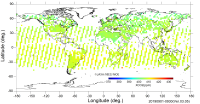
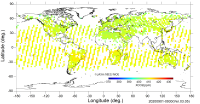
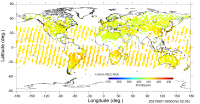
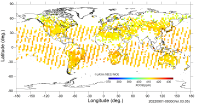
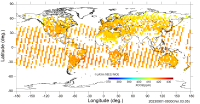
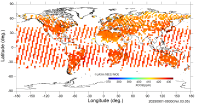
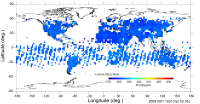
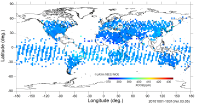
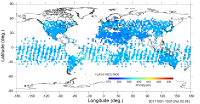
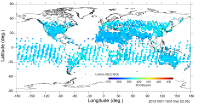
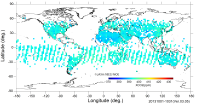
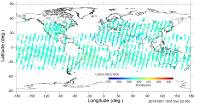
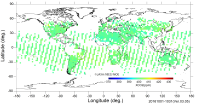
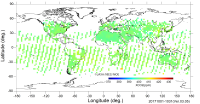
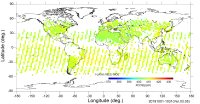
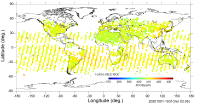
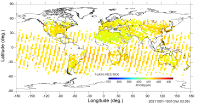
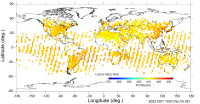
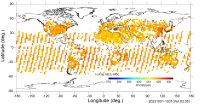
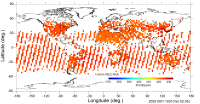
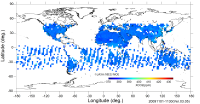
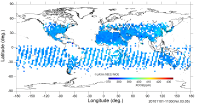
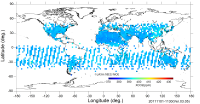
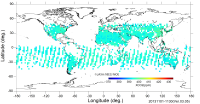
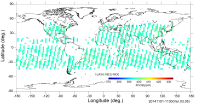
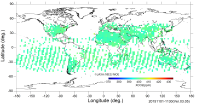
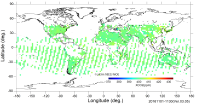
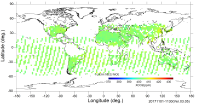
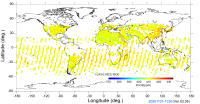
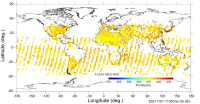
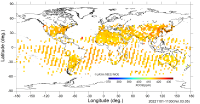
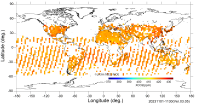
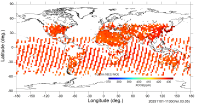
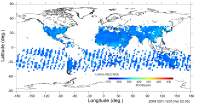
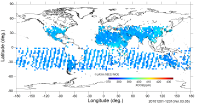
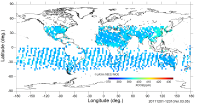
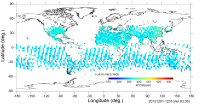
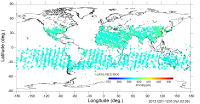
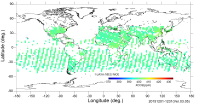
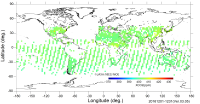
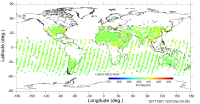
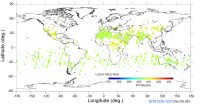
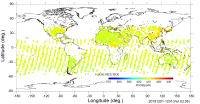
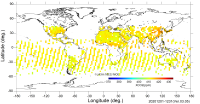
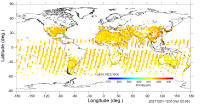
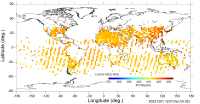
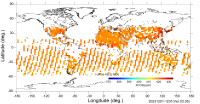
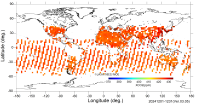
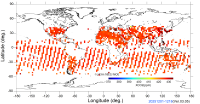
Monthly Global Map of the CO2 column-averaged volume mixing ratios in 2.5 deg by 2.5 deg mesh(Bias-corrected FTS SWIR L2 XCO2) (V03.05)
| The range of color scale in this XCO2 map is from 370 ppm to 435 ppm. It was changed from its previous version. |
 |
| « Scroll backward | Scroll forward » |
|
« « « « « « « « « « « « |
|
» » » » » » » » » » » » |


| Note) | In the processing of each column data (standard product), Numerical Weather Prediction Model GPV Data provided by Japan Meteorological Agency is used. |
| Note) | The CO2 column-averaged volume mixing ratio is the ratio of the total amount of CO2 to the total amount of dry air contained in a vertical column from ground surface to the top of the atmosphere. The CO2 column-averaged volume mixing ratio is designated XCO2. |
| Note) | Monthly Global Map in this page is generated using the bias-corrected FTS SWIR L2 CO2 product (V03.05). |
| Note) | Date in blue indicates FTS SWIR L2 XCO2 data insufficiency during the month. |